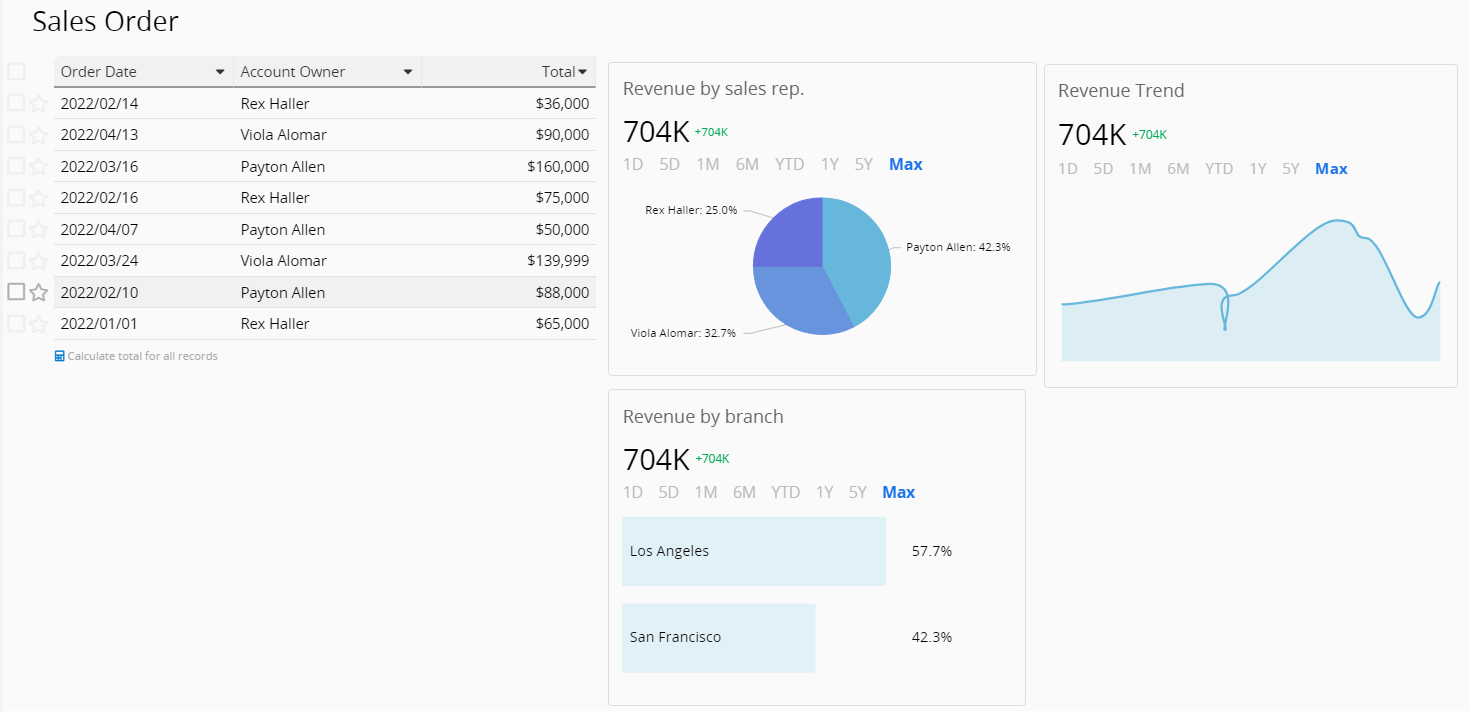
You can insert widgets directly on your sheets to for data visualization, such as using a pie chart to display revenue by sales reps or revenue growth trend next to sales data.
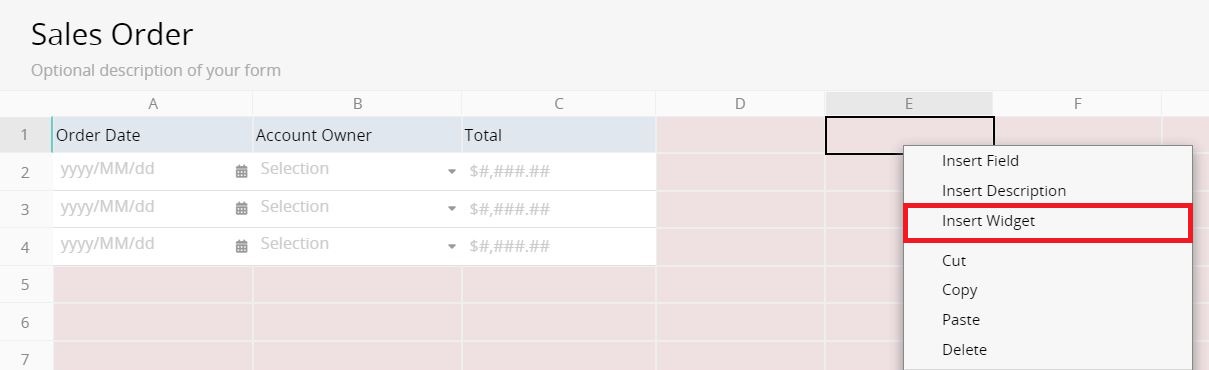
In the Listing Page's or the Form Page's Design Mode, you can right-click on Insert Widget to insert a widget on your preferred location.
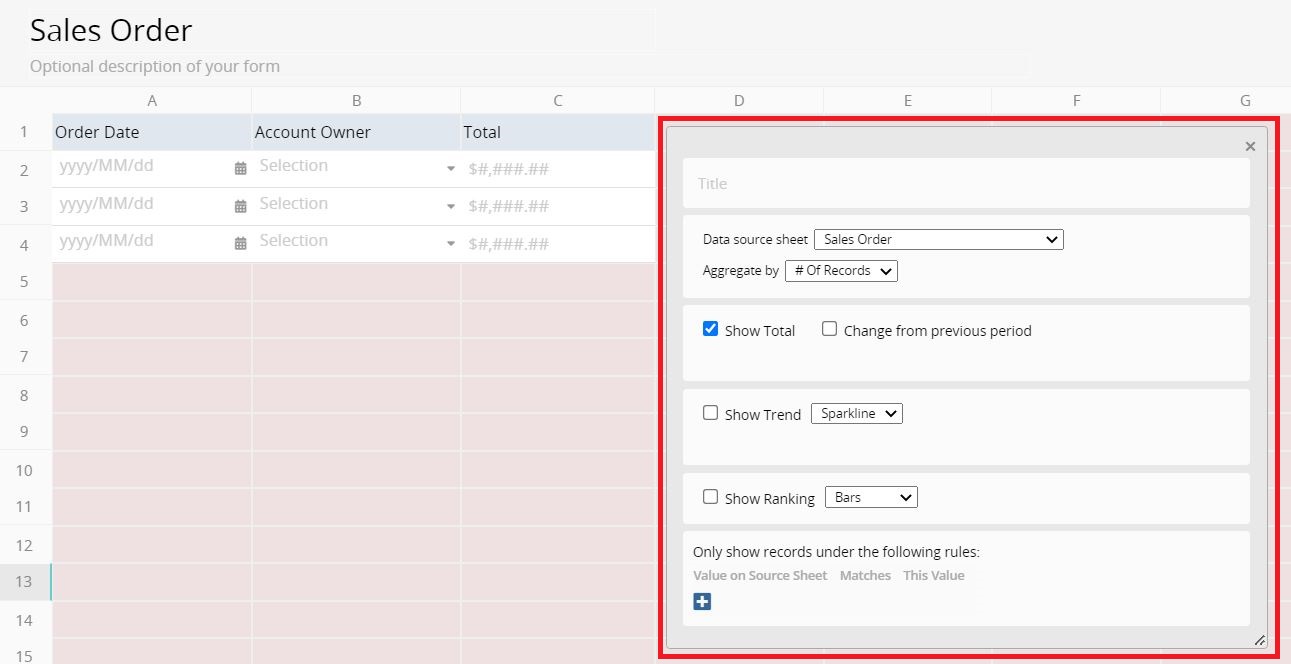
You can name the widget, select the source sheet, and configure what kinds of graphs you want to display in this window. There are two kinds of widgets to either show trends (Sparkline, Bars, 3D bars) or show rankings (Bars, Pie, Tree map, Radar, displaying top 5 categories only). You can further decide whether to display the total and changes from the previous period. In addition, you may show records under certain rules, for example, only analyze sales orders with the status "Completed".
Besides, you can drag and drop the widget to anywhere in the sheet and you will be able to insert multiple widgets in a sheet.
Please refer to the chart below for the filtering mechanisms of widgets in different locations.
| Widget Location | Filtering Situation |
|---|---|
| Homepage Widget | Filtering priority: Fixed filters > Filter conditions set within the widget. All of these will affect the displayed data. |
| Listing Page Widget | Filtering priority: Fixed filters > Custom views and shared views > Filter conditions set within the widget. All of these will affect the displayed data. |
| Form Page Widget | Filtering priority: Fixed filters > Filter conditions set within the widget. All of these will affect the displayed data. |

