If you don't see any options featured below on your database sheets, it may be related to the access rights you are granted. If you have any questions about your access rights or not being able to view or generate reports, please contact your SYSAdmin of the database to check for the proper access rights configurations.
Ragic has a few types of reports that you can generate from the data you have in your Ragic sheets.
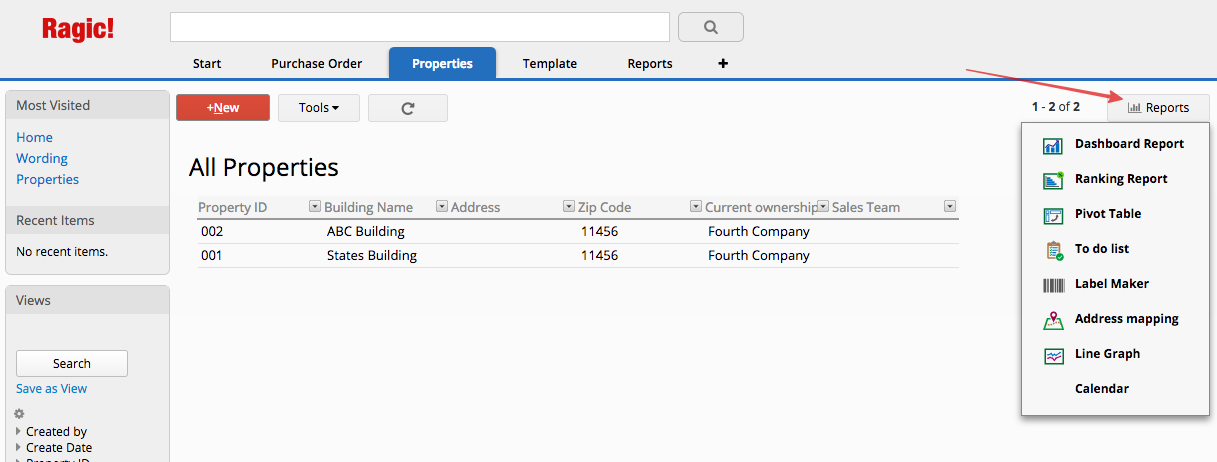
To generate a report from your data, you may first filter out the entries if necessary. Click on the Report button at the upper-right corner on the listing page.
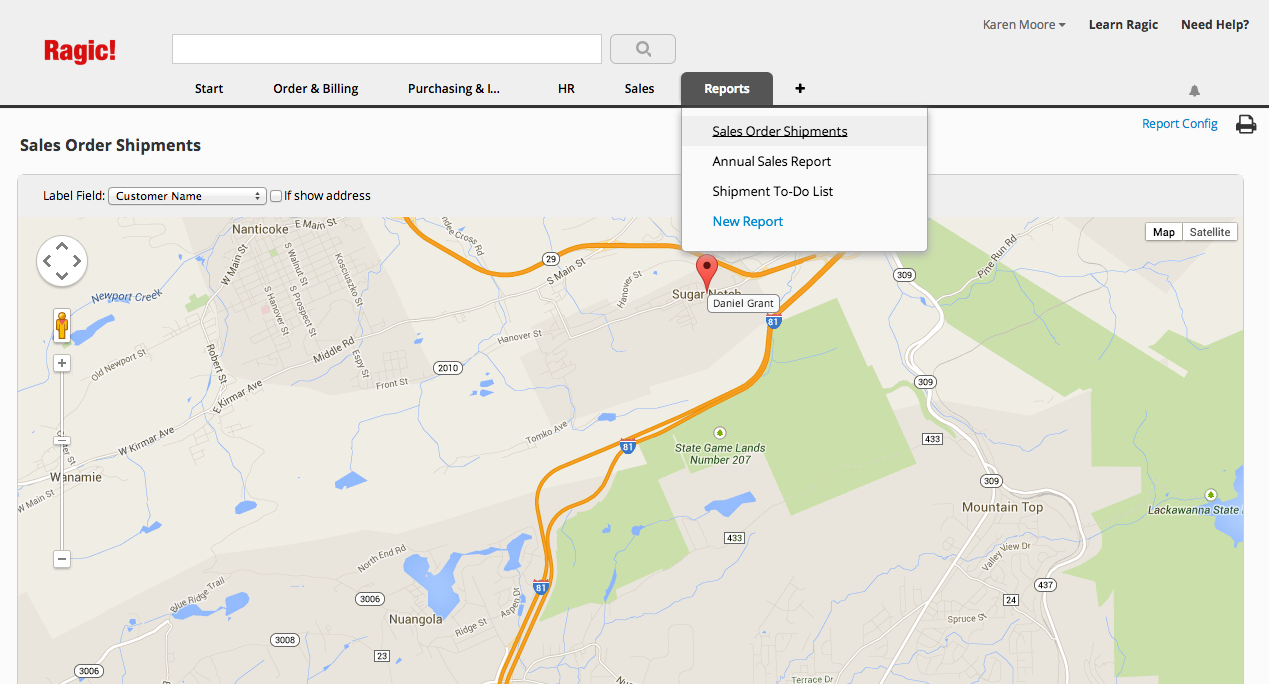
You may also find saved reports under the Reports tab for easy access. (This is only visible when your SYSAdmin saves reports with the source data that you have access rights to.)
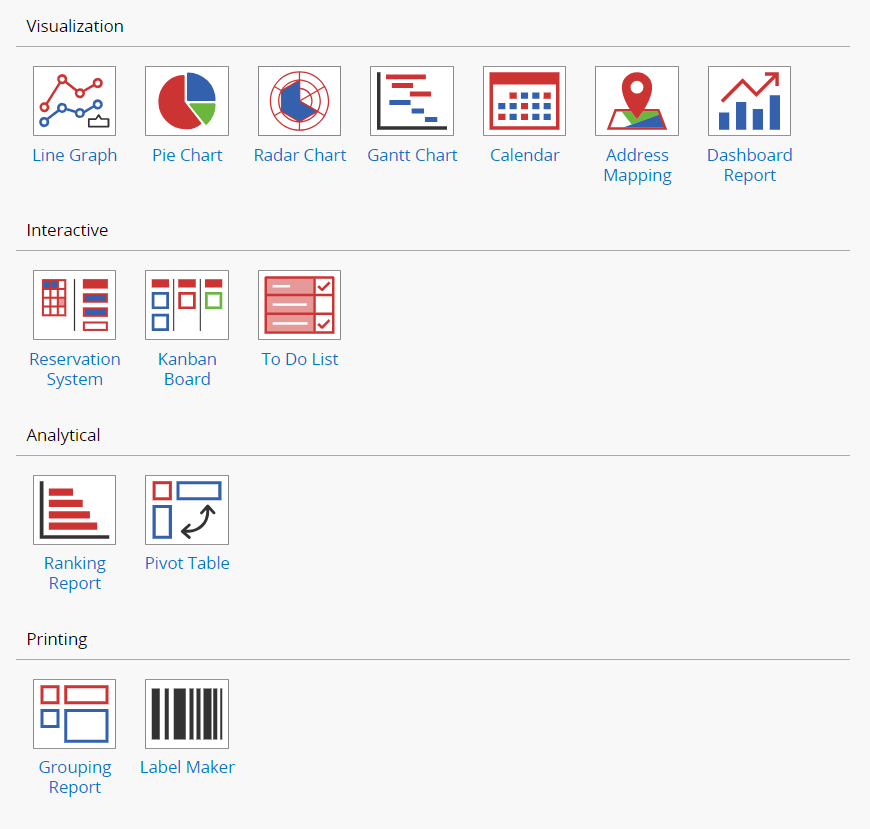
Here is an introduction to the types of reports that Ragic offers:
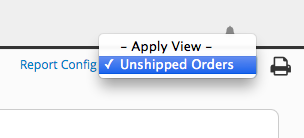
Your report will be generated according to the filter you have applied, but you can also generate reports for a certain shared view to display results within a different filtered criteria. You can change the applied view within the report, from the top-right side.
If a fixed filter view is applied to your sheet, the report will display results accordingly.
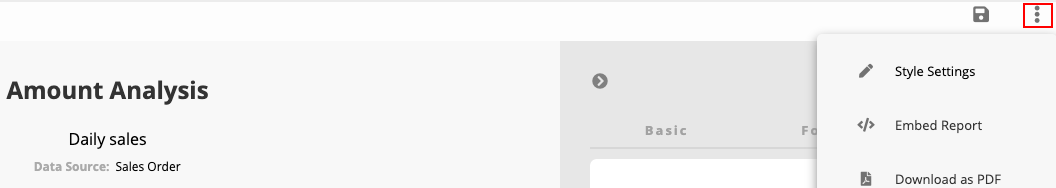
You can configure style settings in any report. By clicking the "more" icon at the top right corner, you can see style settings in the first option.
There are three things that you can configure in style settings.: Basic, Font, and Boundary.
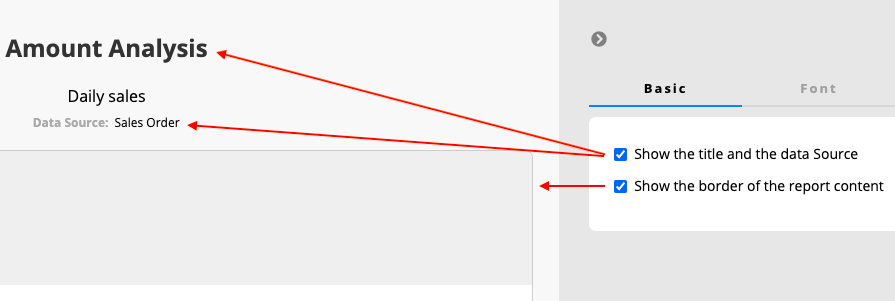
You can refer to the image below to know what you can configure in Basic.
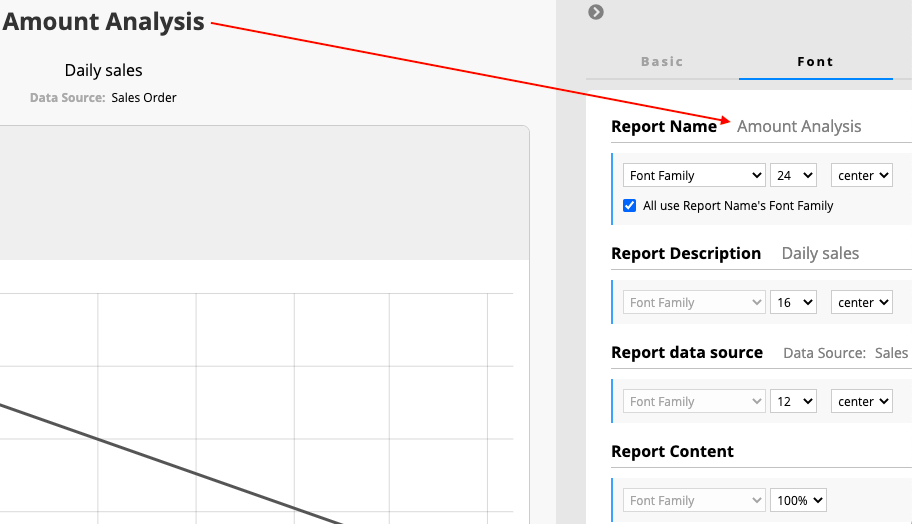
You can adjust the Font, Font Size and Alignment here.
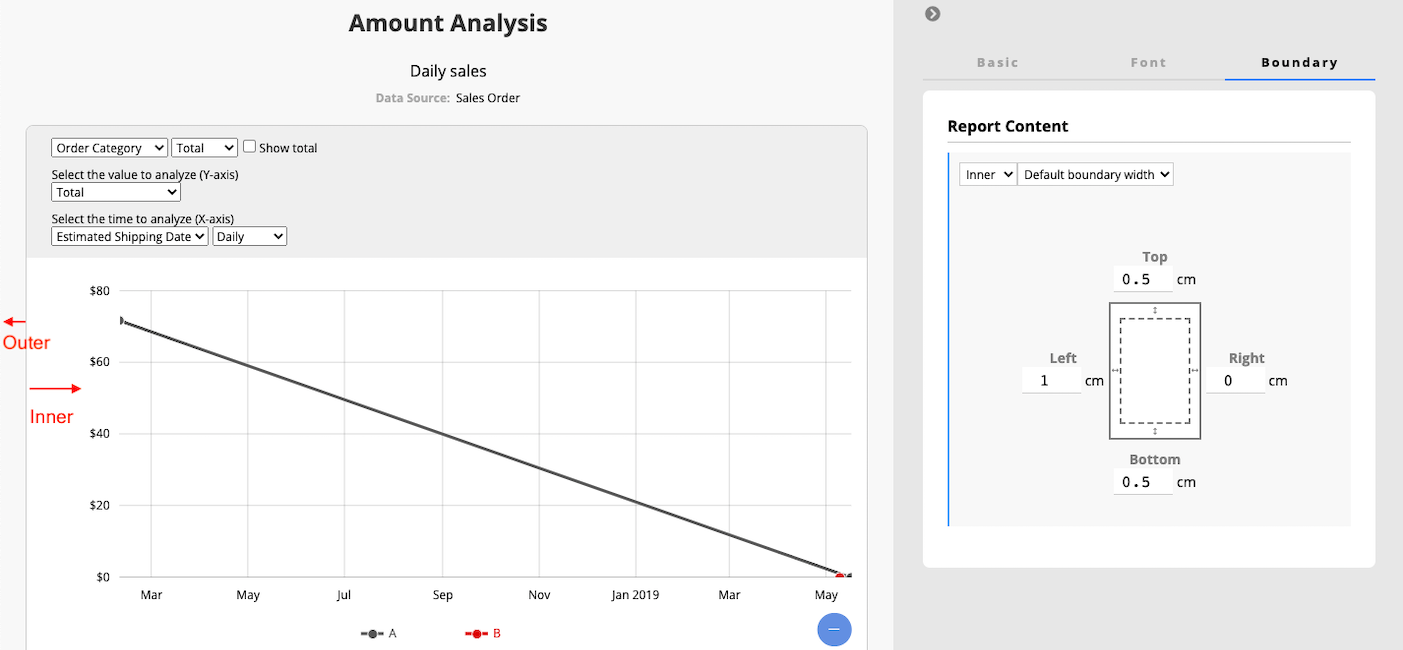
You may modify a report's inner boundary and outer boundary.
Inner boundary means the distance between the border and the report content.
Outer boundary means the distance between the border and the browser border.